
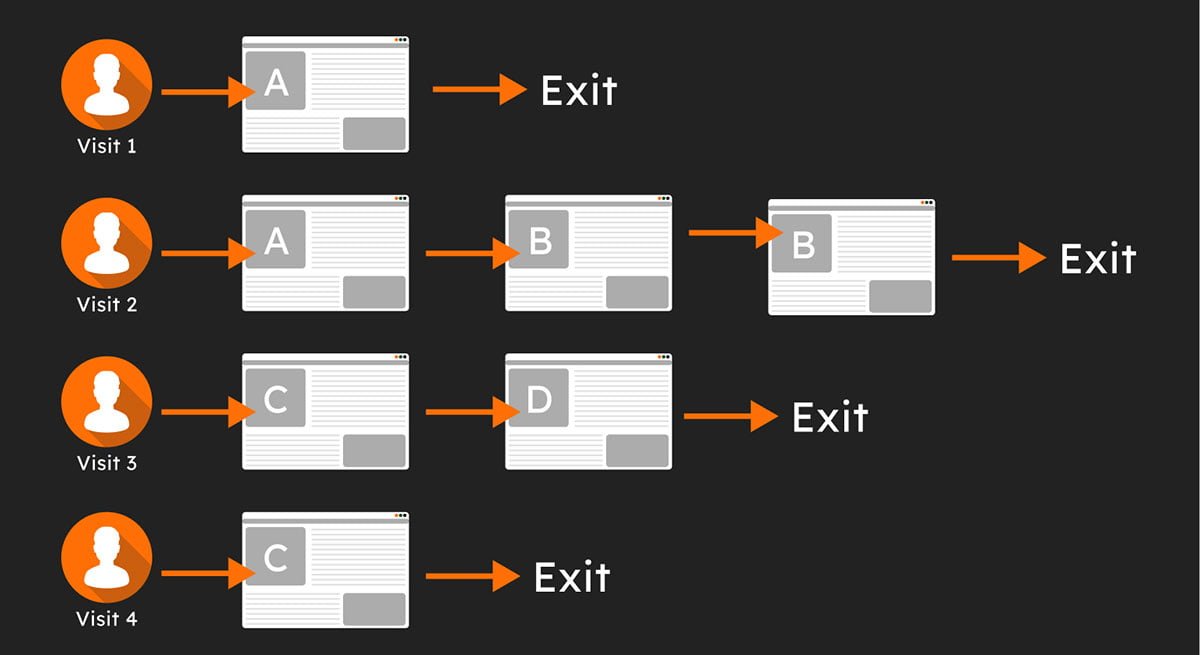
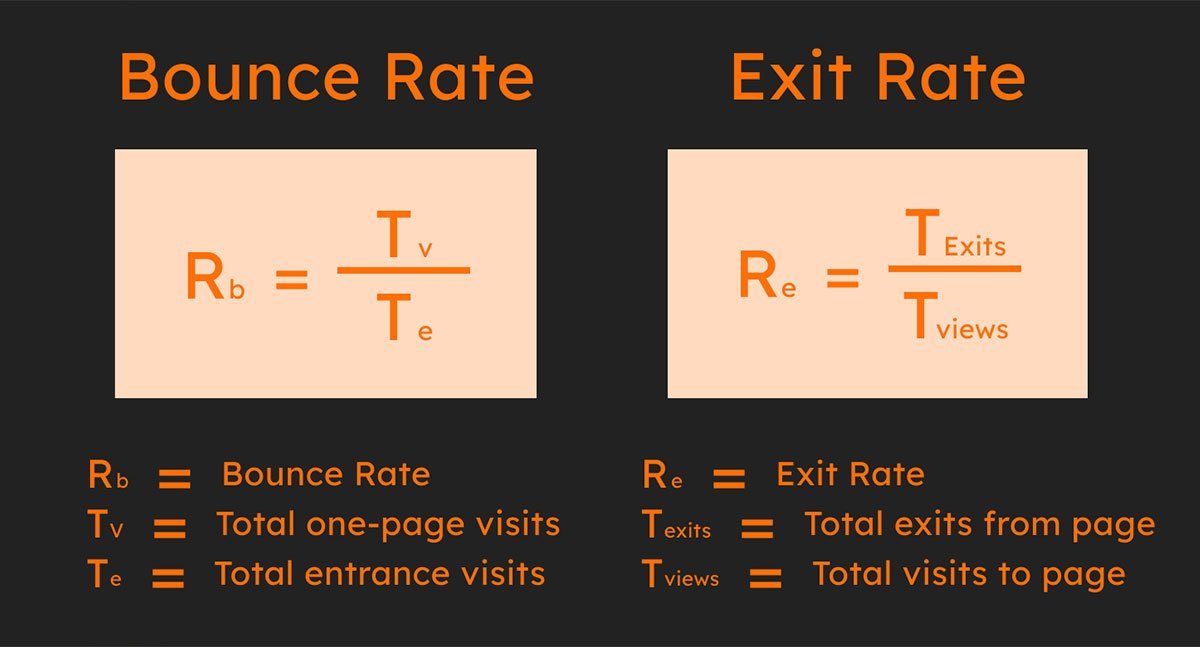
What is Exit Rate?
Why It Matters:
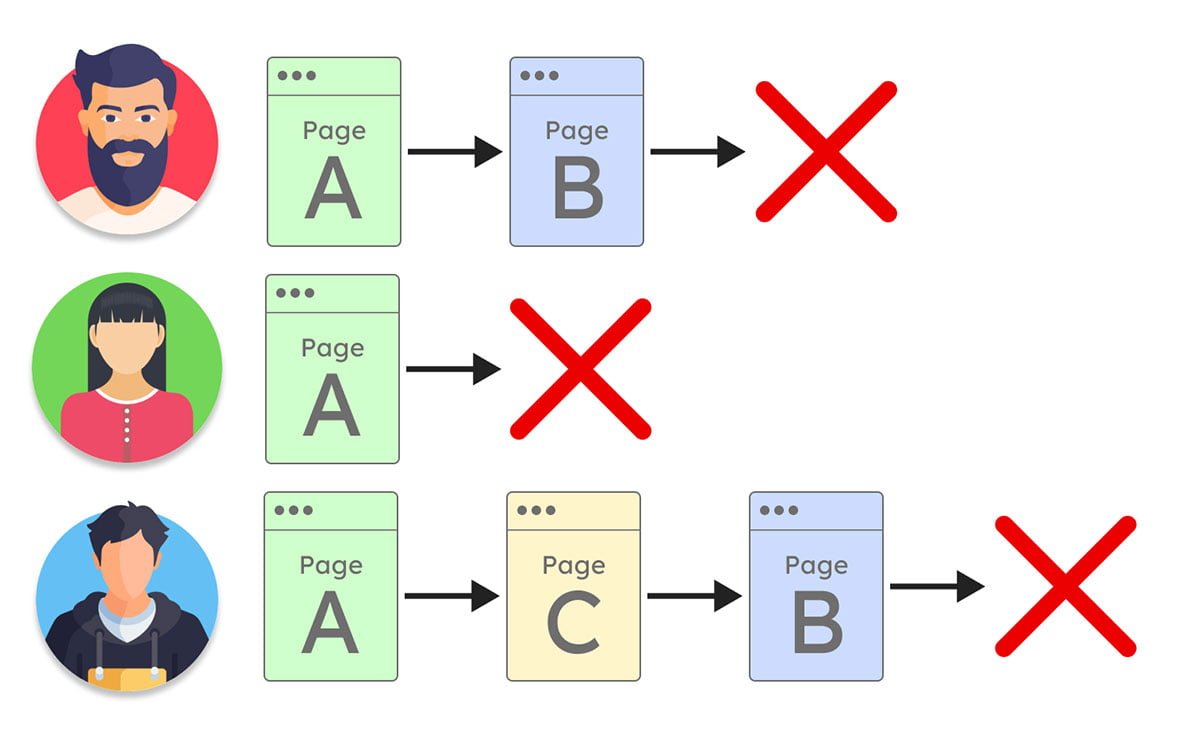
What is the Bounce Rate?
Why It Matters:
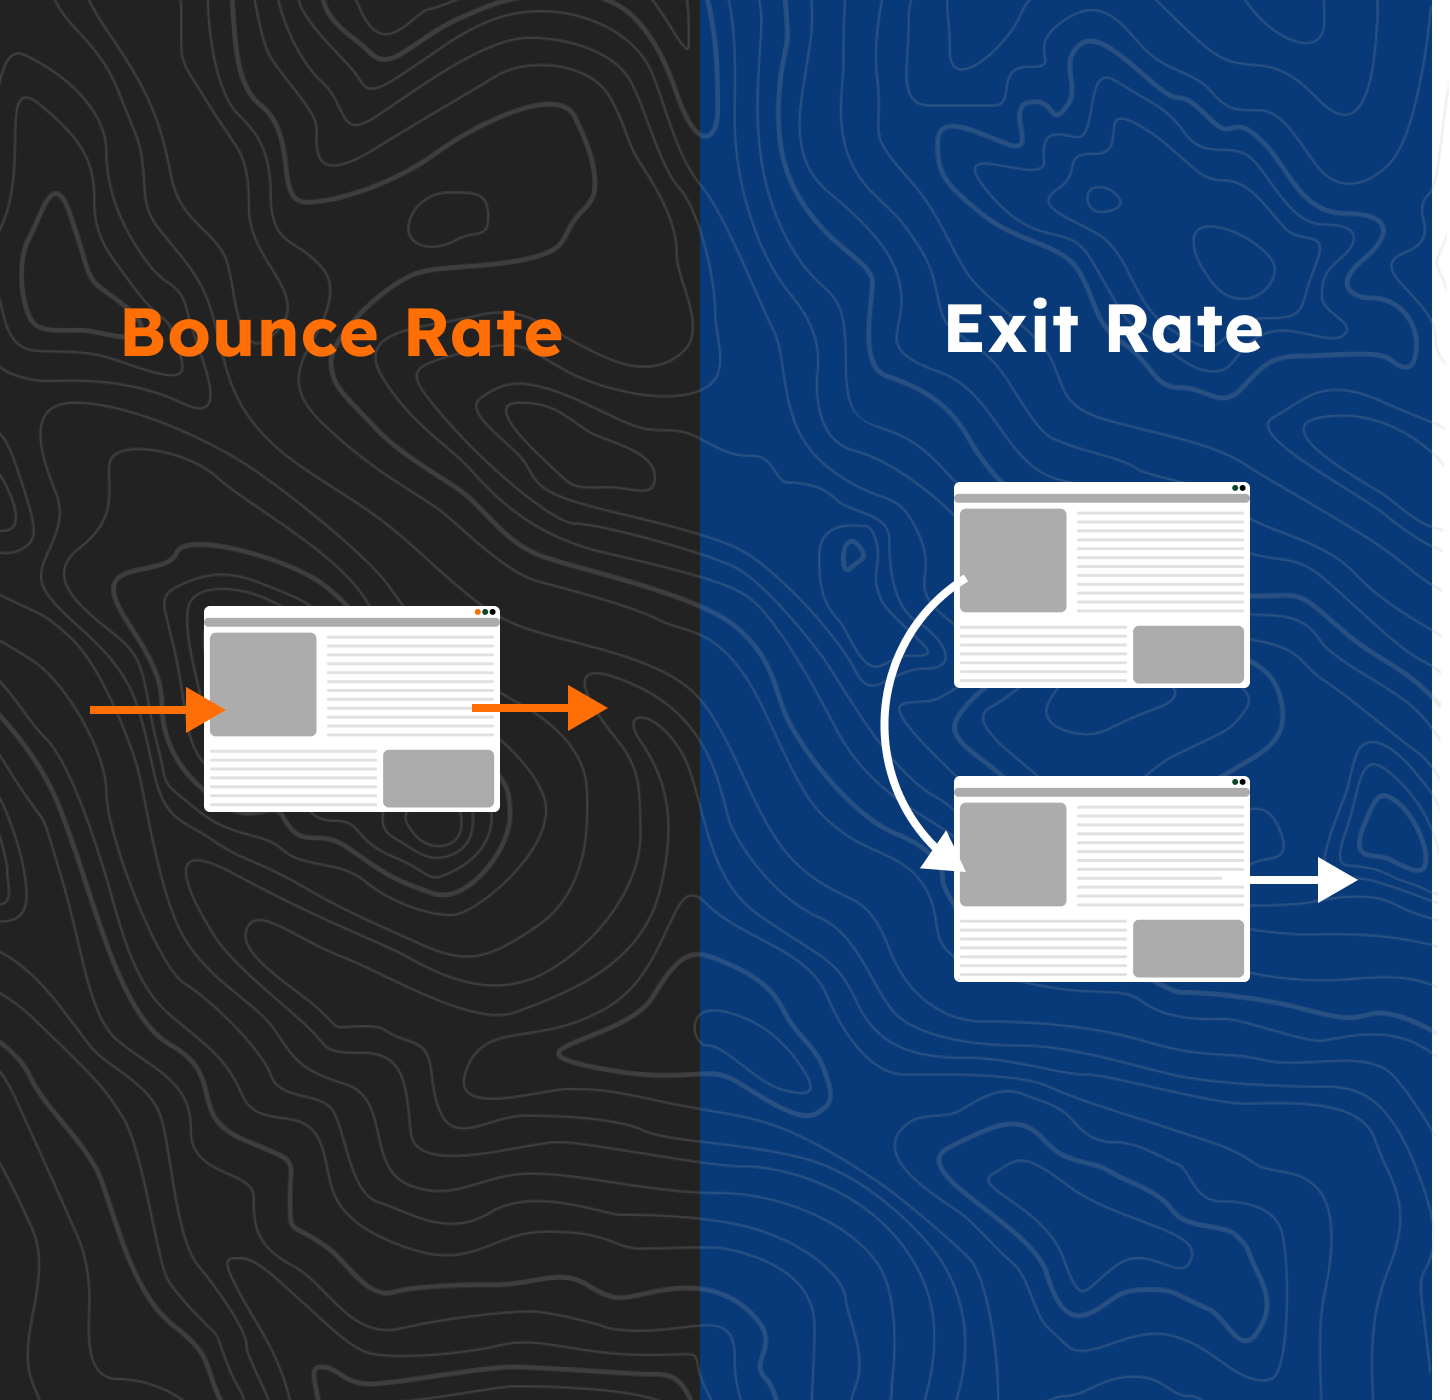
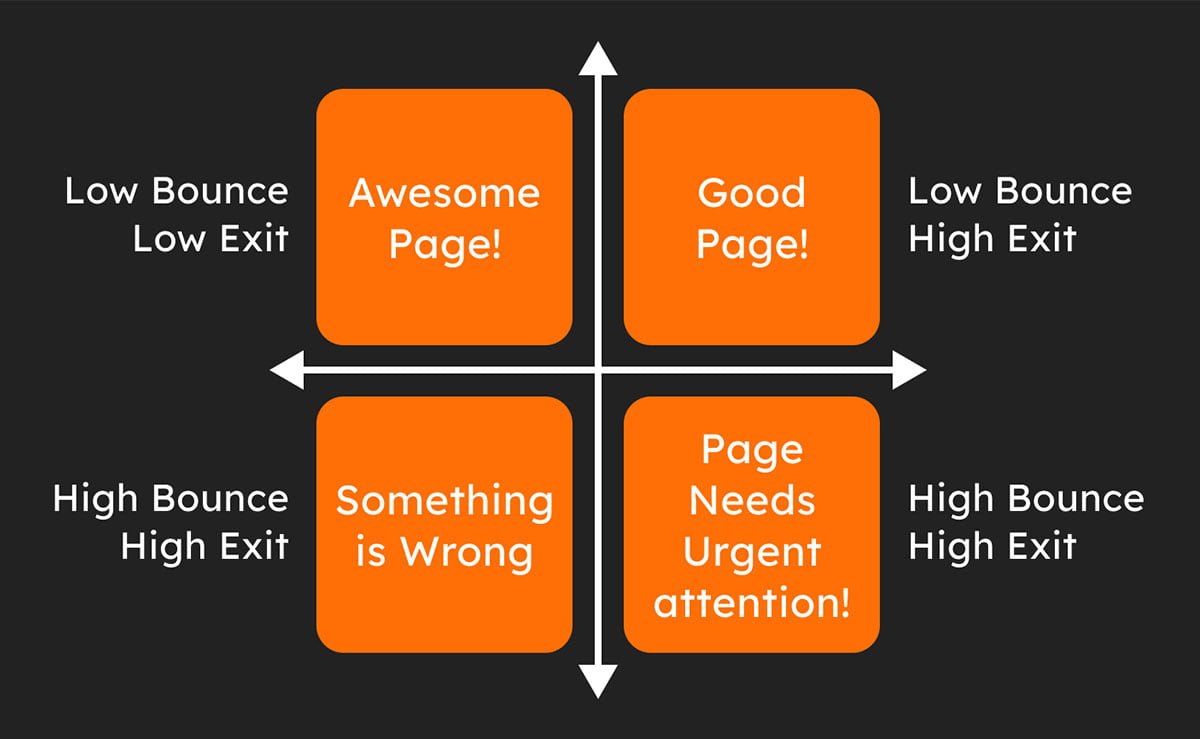
Bounce Rate vs. Exit Rate: What's the Major Difference?
- Bounce Rate : looks at visitors who land on one page and then leave without clicking anywhere else. It shows whether people are engaging with the first thing they see.
- Exit Rate: looks at the percentage of people who leave from a particular page, no matter how many pages they visited before. It helps you spot where visitors are dropping off in their journey.
Common Misconceptions
A High Exit Rate Isn't Always Bad News
Is a High Bounce Rate a Problem? Think Again
Practical Examples

Case Study 1: E-commerce Website
Case Study 2: Content Website
Ways to fix it:
- Improve readability: Break up the text with short paragraphs and catchy subheadings.
- Engage your readers: Use compelling visuals and relatable language.
- Make your content more relevant: Focus on what your audience wants to read.
Strategies to Improve Both Metrics

Lowering Exit Rates:
- Speed Things Up: No one likes waiting. If your site takes too long to load, people might leave before they even see your content. Keep it quick and smooth to hold their attention.
- Simplify Navigation: Your website should be easy to explore. If visitors can’t find what they’re looking for quickly, they’ll likely leave. Make sure your site is easy to navigate.
- Be Clear with Your Calls-to-Action: Think of this as guiding someone through a process. Clear and straightforward instructions help visitors know what to do next and encourage them to stay engaged.
Lowering Bounce Rates:
- Make Your Content Relevant: Your content should speak to what your audience cares about. The more it resonates, the more likely they’ll stick around.
- Optimize for Mobile: Lots of people browse on their phones, so make sure your site works just as well on mobile as it does on a desktop.
- Add Interactive Features: Keep things interesting with videos, quizzes, or infographics. These elements can make your site more engaging and encourage visitors to stay longer.
Even small improvements in these numbers can lead to more engaged visitors and better results. If you’re looking to keep people on your site longer and turn more clicks into conversions, our conversion rate optimization services can help. We focus on lowering bounce and exit rates so your visitors stay, explore, and take action.
Tools and Techniques for Monitoring and Analysis

When it comes to improving your website’s performance, having the right tools and techniques on hand makes all the difference. By fully utilizing Google Analytics and a few other helpful tools, you can really understand how visitors interact with your site and make smart, informed decisions to improve it.
Getting the Most Out of Google Analytics
- Set Up Custom Reports and Segments: Customize your reports and segments to focus on the metrics that matter most to your business. This way, you can identify specific user behavior patterns and adjust your strategies to meet your goals.
- Use Behavior Flow Reports to Understand User Paths: Visualize how users move through your site. By identifying common entry and exit points, as well as areas where users tend to drop off, you can improve your site’s navigation and content.
Additional Tools to Improve Insights

- Heatmaps and Session Recordings: Tools like Hotjar or Crazy Egg show you exactly where users are clicking, scrolling, and spending their time. Watching session recordings lets you see real-time interactions, helping you spot issues and better understand user behavior.
- A/B Testing and User Surveys: Conduct A/B testing with tools like Optimizely or Google Optimize to determine which version of a page performs better. Surveys also provide direct feedback from users about their experiences and preferences, giving you valuable insights to improve your site.
When you combine these tools with Google Analytics, you get a clearer view of what’s working and what needs fixing. If you want expert support, our Google Analytics consulting service is built around your goals, giving you insights that actually lead to smarter decisions and better results.
Conclusion
Knowing how to read bounce and exit rates can seriously help your website do better. These numbers show you where people are dropping off, and once you understand that, you can make simple changes that actually work. At Analyze Right, we help you break down what the data really means and turn it into an experience your visitors actually enjoy.
